
Grain Markets on a Knife’s Edge: Volatility, WASDE, and What Comes Next
It’s been a wild ride for grains this week.
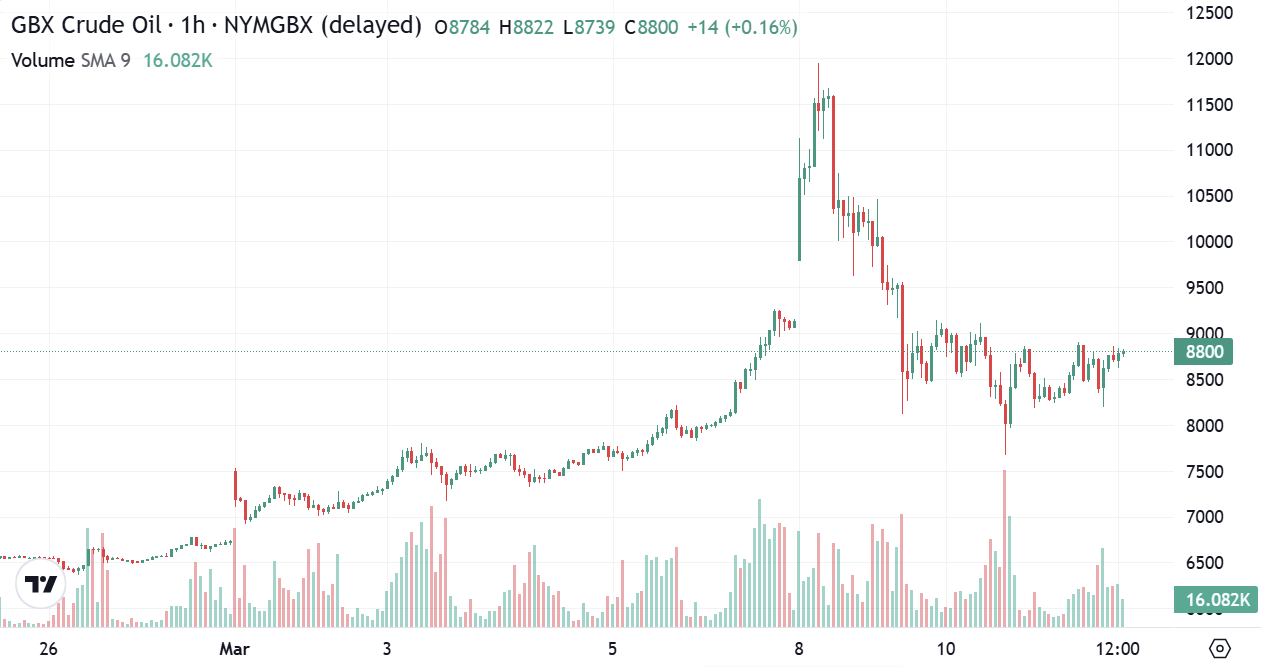
Sunday evening opened with gap-higher trade as grains followed the energy markets. Prices peaked around midnight, then violently reversed, with additional fallout into Tuesday. Hourly charts show the gap higher, a near touch of $120 crude oil, and then a sharp flip lower toward $80.
Volatility isn’t a side note — it’s the story.
WASDE Recap: Limited Adjustments, Lingering Doubts
By Tuesday at 11 a.m. CST, WASDE was released — and almost forgotten before it hit the wires.
USDA made no changes to wheat or corn S&D tables. Soybean crush was raised 5 mb, offset by a 5 mb increase in imports. No change to domestic soy carryout. Globally, wheat carryout was slightly reduced, while corn carryout increased roughly 4 mmt, driven by Ukraine (+1.7 mmt) and Brazil (+1 mmt), partially offset by Argentina (-1 mmt). Domestic corn usage was lowered.
Doubts are common when people discuss the USDA S&D assumptions, and this year is no exception. USDA reports that through January, 15 million bushels less corn was ground for ethanol, but they still project a 164 million bushel year-over-year increase in usage. Read that again while looking at what is going on with energy prices. Even if margins are good, are people driving more with higher-priced fuel, or is it more likely that we will see ethanol stocks rise, fill inventories, and compress margins, causing plants to slow down?
Let’s not forget Feed and Residual demand is pegged 746 million bushels higher year over year, while cattle numbers are down, what, 1-2% from a year ago? Are the acreage and yield pieces set until October? If things don’t change, demand could be overstated by 850-950 million bushels. That’s a heck of a rounding error. I’ve still got my doubts on acres and yield, but have no expectation that those numbers will change until October, after the Sep 30 stocks report has been released.
With WASDE behind us for the month, traders will continue to focus on the US/Iranian conflict, keeping in mind that prospective acres and quarterly stocks estimates will come from USDA on Mar 31st. Most are expecting corn acres to be down, and with some estimates of 94 million corn and 85 million acres of beans.
I have a hard time arguing against that today. There’s a double-bottom looking pattern forming on the cotton chart, but it doesn’t appear to be buying many acres. But I’m a northerner and ignorant when it comes to cotton. Maybe acres are a bit higher with the rally in row crops.
So where do things go from here?
Corn Futures Outlook
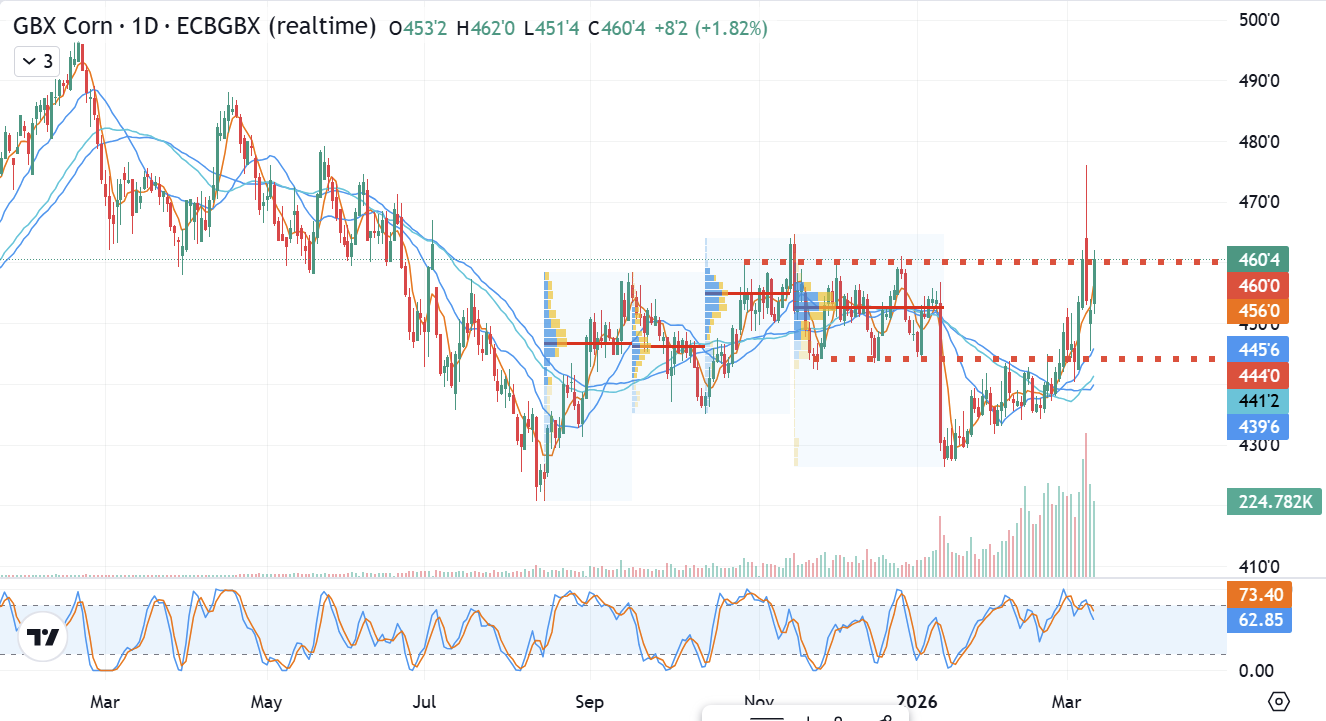
There are many charts we could look at. Weeklies. Monthlies. Let’s look at the daily chart. Prices have recovered all the losses from the Jan report and then some. Today’s close is about the same as Friday's. Basis markets are widening out quickly, and some are going no-bid. May-Jul corn closed at 11’6 carry. The cash market is effectively saying, "NO.
USDA’s data is not supportive either. Energy provides a tailwind for now, and if acres are down, it would help. The weekly chart would suggest 465 then 490 as possible upside targets where spot corn futures peaked last winter, but the situation looks a lot different than it did a year ago.
One thing that is bullish is the Chinese corn price, but there’s no telling what will happen there yet. 460 has been a pivot point on the chart. We’ll see where it pivots next.
Soybean Market Analysis
Soybeans present an interesting setup. USDA appears to be slow-rolling the crush story. Board crush is fantastic, but they only made a minor change there. Meanwhile, soybean sales are hitting the levels necessary to continue moving the chains downfield, and there is a phone call scheduled for Presidents Trump and Xi soon, with a meeting planned for early April. I don’t think many want to be caught short in front of that, given President Trump's record of getting things done.
For me, the Supreme Court's tariff ruling flipped the switch that, continuing to hold beans, posed a significant risk, but beans have continued to rally anyway.
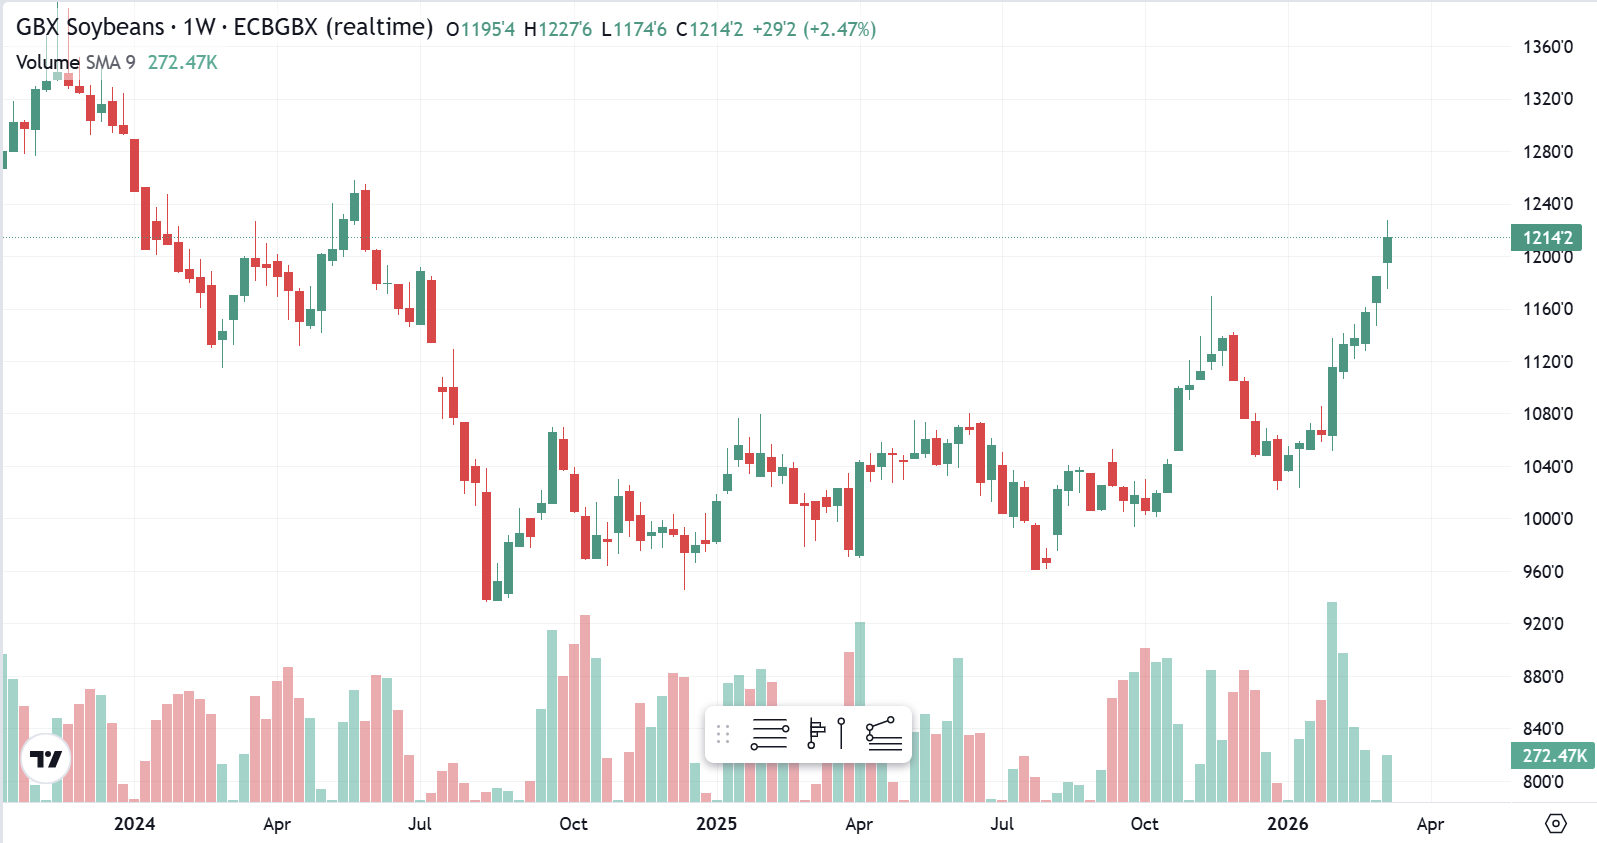
Futures spreads are not overly bullish, nor is the basis in our local market. Acres are expected to rise significantly from last year in the Mar 31st estimates. Managed Money is sitting on a very large, long position on top of this. That’s a lot of confidence.
The next upside objective appears to be 1240 on the weekly chart, while support appears to be 1175, then 1150. A close below 1135 could turn things really ugly.
Wheat Market Trends
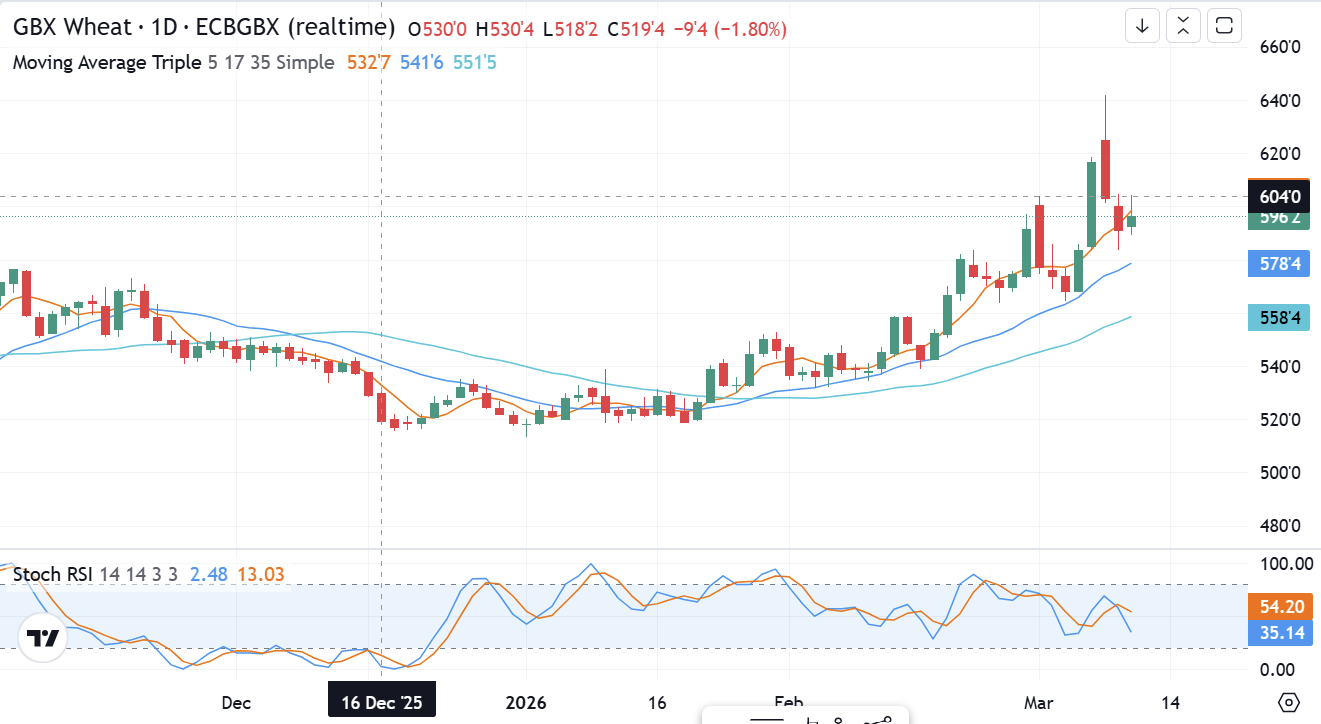
Wheat started to rally in advance of the conflict, presumably as short sellers began to roll their positions forward, similar to what we saw as the calendar approached first notice day. Export sales have been enough, but I would expect the same year sales to tail off here soon as the end of the marketing year approaches (May 31st).
Basis has been sliding with reports of mills going no-bid. Similar to the other commodities, futures spreads were not and are still not bullishly positioned up front. We’re seeing spreads firm up sharply in the deferred months, but I question whether that’s truly a function of a tightening market or just order flow as buyers bid up the front end. Right now, I’m inclined to believe the latter, but I also realize that there are things we don’t know.
How long will this conflict last?
Who else may or will become involved? Since last fall, the S&D has gotten heavier as production estimates for last year have increased. Managed Money was still short as of Tuesday a week ago, but I wouldn’t be surprised to see that short erased come Friday afternoon. By the way, it’s 2026.
Can we get the COT report caught up to within a day? Why does the trade operate on a report that, at best, is 3 days old?
The Bigger Picture: Risk, Liquidity, and Logistics
This rally has offered opportunities for both old and new crop bushels.
But here are two critical questions:
If this rally falls apart, do you have the liquidity to reach the next one?
If this rally falls apart, do you have the storage to wait it out?
This isn’t financial advice.
But those are practical questions.
The market is volatile for a reason. It doesn’t know how to price current scenarios — so it’s moving toward the path of most pain.
And right now, that path changes daily.

Garret Brown
Founder | Market Advisor
Having grown up on a farm, Garret respects the wide range of skills needed to run a successful operation and recognizes farmers are often stretched thin trying to do it all. This understanding, along with his affinity for markets, fuels his drive to make tough marketing decisions simpler for farmers.
Leveraging his experience in grain origination and margin management, Garret analyzes technical and fundamental market information. With the assistance of CODAK’s algorithmic signaling platform, he puts together buy/sell recommendations while working with the CODAK team to create strategies that accommodate each farmer’s personal risk tolerance, on-farm storage capacity, and break-evens.