
USDA Answers, Questions Remain
“Does anyone have any questions for my answers?”
--Henry Kissinger
USDA dropped its annual benchmark acreage and quarterly stocks report last Tuesday.
Here’s the rough analysis – the “answers”
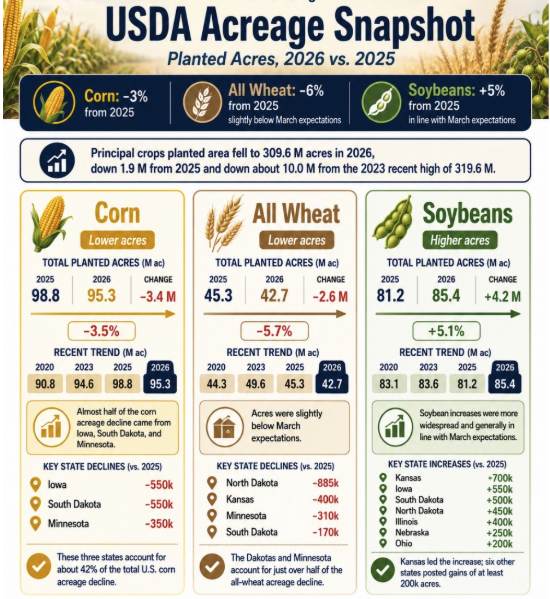
USDA’s 2026 acreage snapshot shows a 3% decrease in corn, a 6% decrease in all wheat, and a 5% increase in soybeans compared to 2025, with total planted acres falling to 309.6 million from 319.6 million.
Now what? The “questions”
Kissinger’s quote gets looked at through the lens of diplomacy, but cynically, it can mean that the answers are what they are, and oftentimes, they do not answer the questions you asked.
What questions do we have now?
What will yield be?
We trade the acres we have now — the question is yield, which is almost entirely determined by where, how much, and how often it rains over the next eight weeks. USDA has corn at 183 bpa, soybeans at 53 bpa, and wheat at 47 bpa. What is your bias? Anecdotally, our team of advisors sees more reason to forecast declining yields, with noteworthy exceptions on well-drained fields.
What will demand be?
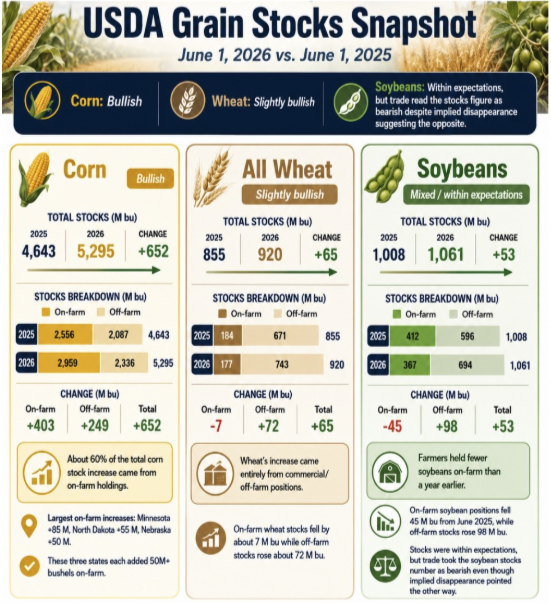
The stocks report tells us who is holding the grain. It does not necessarily say what amount of grain is priced ahead, but with the marketing year ending August 31, one can expect the trend up or down year over year to at least correlate with the percentage of unsold bushels. That gives some indication about where basis opportunities may exist, if coupled with regional yield expectations. In general, absent new crop yield concerns, there is not much cause for the market to rise and ration bushels.
Will these numbers stay reasonably the same?
In other words, how accurate are today’s posted USDA numbers? Remember, last year we saw U.S. corn acreage at 95.3 million in June, but it grew to a whopping 98.8 million by January. We probably should expect an increase again, given how neatly today’s report fits March expectations.
A related question: Is USDA focused on just estimating statistics, or price and economic stability? It is no secret that many in the trade, CODAK included, are skeptical of USDA data. And an election year adds to that suspicion.
What story are we overlooking?
CODAK suspects the soybean market is more interesting than most think. Using today’s 85.4 million-acre estimate and current USDA projections, we arrive at a stocks-to-use ratio south of 6%. And that is paired with a record 53 bpa estimate, while we see plenty of yellow and soon-to-be brown spots in wet soybean fields.
On-farm stocks are down, a record yield seems doubtful, and demand is excellent. If we use 51.1 bpa instead, the average of the 2020–2025 growing seasons, we arrive at a sub-2% stocks-to-use ratio. While we should not get too optimistic, this is not an unreasonable scenario.
If yields do decline meaningfully, does USDA adjust in piecemeal over multiple reports? Or do they wait until the following summer when basis and spreads scream foul? Maybe the wet spots are not as bad as we think now, and 53 bpa is a fair yield. Regardless, it seems prudent to respect the upside potential.
This is why we follow the macros, technical indicators, money flow, and the fundamental factors. Ultimately, the futures and cash markets converge, and it all sorts itself out as the market rations supply and demand. Between now and then, we have many questions that may remain unanswered.
No one in marketing gets all the answers for every question, but that need not derail executing solid marketing decisions.

Andrew Bowman
General Manager - Insurance| Market Advisor, Central Midwest
A former client turned Market Advisor, Andrew, oversees Illinois and the surrounding region. He also leads the CODAK Insurance Group, integrating crop insurance into our clients’ marketing strategies. His focus is on helping clients make confident decisions, gain peace of mind, and protect their working capital.
Connect with Andrew